
Investing In The Current Political Environment With (some) Confidence
by David Feinman

While the current political environment in the United States is without precedent, history teaches that a prudent course for investors is to maintain risk appropriate exposure to a broadly diversified portfolio.
The world has been gripped with political and economic uncertainty since the start of Donald Trump's second US presidential term. Some investors have asked if their portfolios should be adjusted in reaction to the upheaval. Our view at Silverlake is that while the current political environment is without precedent, history teaches that the prudent course for investors is to maintain risk appropriate exposure to a portfolio that is broadly diversified across asset classes and geographical regions.
The Influence of Political Sentiment on Investment Decisions
Investor sentiment and risk perception are often influenced by the broader political landscape. Research indicates that individuals tend to be more optimistic about the economy and financial markets when their preferred political representatives are in power. [7]
While shifts in political sentiment may impact portfolio composition and raw performance, the improvement in risk-adjusted returns is generally modest. Ultimately, regardless of political conditions, disciplined investing based on sound fundamentals and long-term planning has been the most effective approach to achieving a satisfying investment experience.
Focus On The Long Term
Market fluctuations are an inherent part of investing. Historical data underscores this reality—since 1979, the U.S. stock market has experienced an average peak-to-trough decline of 14% within each calendar year. However, despite these periodic downturns, 37 of the past 45 years have ended with positive annual returns (see Figure 1). This highlights the importance of maintaining a long-term perspective rather than reacting to short-term volatility. By focusing on the bigger picture, investors can mitigate some of the anxiety that can accompany market declines.
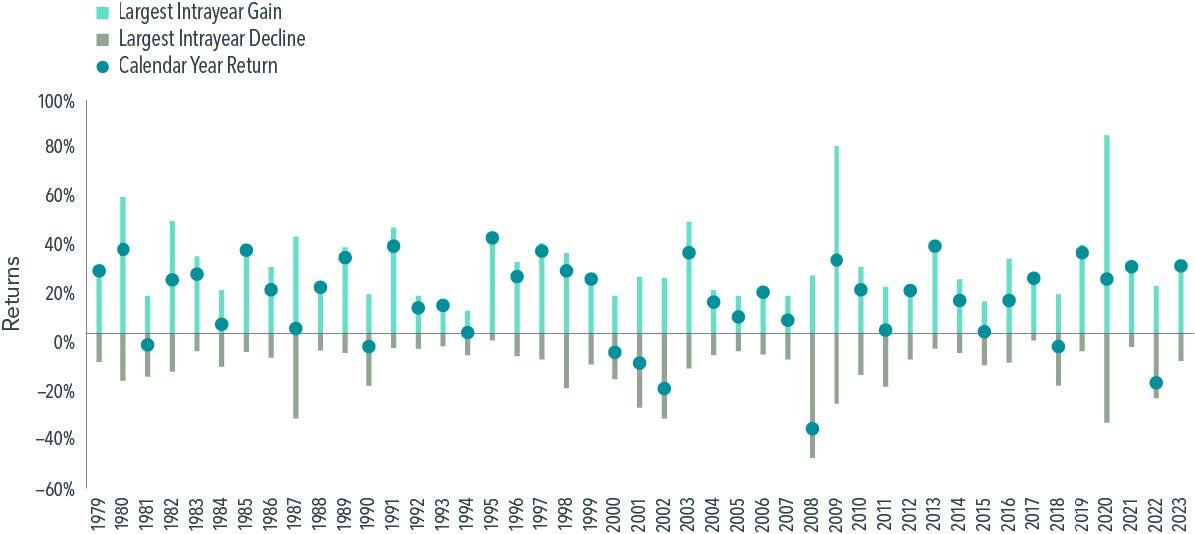
Indices are not available for direct investment; therefore, their performance does not reflect the expenses associated with the management of an actual portfolio. In USD. Data is calculated off rounded daily returns. US Market is the Russell 3000 Index. Largest Intra-year Gain refers to the largest market increase from trough to peak during the year. Largest Intra-year Decline refers to the largest market decrease from peak to trough during the year. Frank Russell Company is the source and owner of the trademarks, service marks, and copyrights related to the Russell Indexes.
Stay Invested
During periods of market turbulence or speculation about an imminent downturn, it might be tempting to sell investments in order to avoid future losses. However, history suggests that remaining invested may be the wiser approach.
Market timing is inherently difficult [8], and missing even a handful of the best-performing days can significantly impact long-term returns (see Figure 2). For example, an investor who placed $1,000 in the S&P 500 in 1990 and stayed invested through 2023 would have seen that amount grow to $27,221. However, missing just one of the best performing days over that period would have reduced the final portfolio value by nearly $3,000. Missing five of the best days would have resulted in a loss of more than $10,000. Given the difficulty of predicting market movements, maintaining a disciplined, long-term approach can help investors capture the full potential of market recoveries.
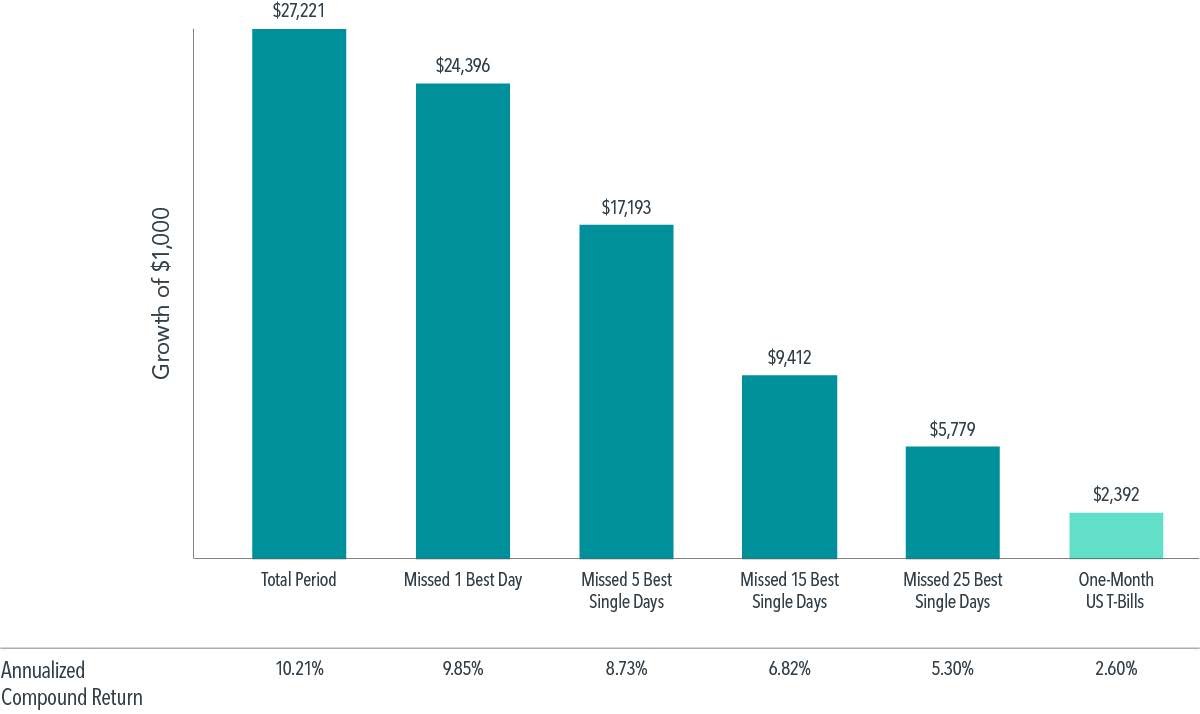
Indices are not available for direct investment; therefore, their performance does not reflect the expenses associated with the management of an actual portfolio. In USD. For illustrative purposes. The missed best day(s) examples assume that the hypothetical portfolio fully divested its holdings at the end of the day before the missed best day(s), held cash for the missed best day(s), and reinvested the entire portfolio in the S&P 500 at the end of the missed best day(s). Annualized returns for the missed best day(s) were calculated by substituting actual returns for the missed best day(s) with zero. S&P data © 2024 S&P Dow Jones Indices LLC, a division of S&P Global. All rights reserved. One-Month US T-Bills is the IA SBBI US 30 Day TBill TR USD, provided by Ibbotson Associates via Morningstar Direct. Data is calculated off rounded daily index values.
Taking a step back from the current moment may provide investors with helpful perspective. Markets have climbed higher through the decades, even amid worrisome world events, and disciplined investors have been rewarded over time (see Figure 3).
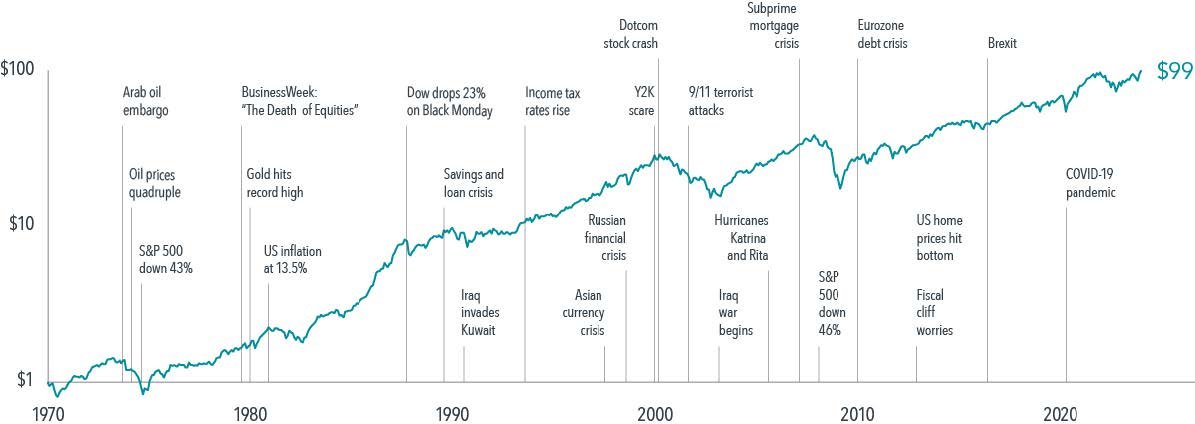
Indices are not available for direct investment; therefore, their performance does not reflect the expenses associated with the management of an actual portfolio. In USD. MSCI data © MSCI 2024, all rights reserved. Data presented in the Growth of $1 chart is hypothetical and assumes reinvestment of income and no transaction costs or taxes. The chart is for illustrative purposes only and is not indicative of any investment.
Align Your Portfolio With Your Risk Tolerance
At Silverlake, we recommend portfolios that align with each client’s risk tolerance and long-term objectives. A well-diversified portfolio, tailored to an investor’s specific financial goals and time horizon, can help provide resilience during periods of market volatility. A financial advisor can play an important role in assessing risk tolerance and constructing a portfolio that balances growth potential with stability (see Figure 4), consistent with each investor’s individualized financial plan.

Source: Dimensional Core Market Index Allocations See “Index Descriptions” for descriptions of the Dimensional index data. The Dimensional and Fama/French Indices represent academic concepts that may be used in portfolio construction and are not available for direct investment or for use as a benchmark. Index returns are not representative of actual portfolios and do not reflect costs and fees associated with an actual investment.
Investing does not have to be an anxiety-inducing experience. By maintaining a long-term focus, staying invested, and maintaining a risk appropriate asset allocation, investors may navigate market fluctuations with greater confidence.
Notes:
1. Dimensional Core Market 100/0 Index Allocation combines the following indices: Dimensional US Adjusted Market 1 Index, Dimensional US Adjusted Market 2 Index, Dimensional International Adjusted Market Index, Dimensional Emerging Markets Adjusted Market Index, and the S&P Global REIT Index (gross dividends).
2. 80% of the weight is allocated to the Dimensional Core Market 100/0 Index Allocation, and 20% of the weight is allocated to the following indices: Dimensional Short-Term Extended Quality Index (10%) and Dimensional US Core Fixed Income Index (10%).
3. 60% of the weight is allocated to the Dimensional Core Market 100/0 Index Allocation, and 40% of the weight is allocated to the following fixed income indices: Dimensional Short-Term Extended Quality Index (25%) and Dimensional US Core Fixed Income Index (15%)4. 40% of the weight is allocated to the Dimensional Core Market 100/0 Index Allocation, and 60% of the weight is allocated to the following indices: Dimensional Short-Term Extended Quality Index (40%) and Dimensional US Core Fixed Income Index (20%).
5. 20% of the weight is allocated to the Dimensional Core Market 100/0 Index Allocation, and 80% of the weight is allocated to the following indices: Bloomberg US TIPS Index (10%), Dimensional US Ultra-Short Fixed Income Index (10%), Dimensional Short-Term Extended Quality Index (50%), and Dimensional US Core Fixed Income Index (10%).
6. The Dimensional Core Market 0/100 Index Allocation combines the following indices: Bloomberg US TIPS Index (20%), Dimensional US Ultra Short Fixed Income Index (20%), and Dimensional Short-Term Extended Quality Index (60%). The Dimensional Indices have been retrospectively calculated by Dimensional Fund Advisors LP and did not exist prior to their index inception dates. Accordingly, results shown during the periods prior to each index’s index inception date do not represent actual returns of the index. Other periods selected may have different results, including losses. Backtested index performance is hypothetical and is provided for informational purposes only to indicate historical performance had the index been calculated over the relevant time periods. Backtested performance results assume the reinvestment of dividends and capital gains.
7. https://www.silverlakeportfolio.com/more-notes/2020/9/12/do-election-outcomes-predict-portfolio-performance-dx6ma
8. https://www.silverlakeportfolio.com/more-notes/2019/7/10/timing-isnt-everything
Dimensional Core Market 100/0 Index Allocation: Dimensional Index Allocation data compiled by Dimensional. The Dimensional Core Market 100/0 Index Allocation combines the following indices: Dimensional US Core Equity Market Index, Dimensional International Core Equity Market Index, Dimensional Emerging Markets Core Equity Market Index, and the S&P Global REIT Index (gross dividends). The weight of the REIT index is based on the market capitalization weight of equity REITs within the global universe of eligible stocks and equity REITs, rounded to the nearest 1%. Within the remaining non-REIT allocation, the US equities are overweight relative to their market capitalization weight. The weights of the US, Developed ex US, and Emerging Markets equities are then rescaled to sum to the total non-REIT weight of the Index Allocation and are all rounded to the nearest 1%. Regional weights are determined at each quarter end and held constant for next three months. The Index Allocation returns are calculated monthly as a weighted average of the returns of the underlying indices. The Index Allocation has been retrospectively calculated by Dimensional and did not exist prior to March 2020.
Dimensional Core Market 80/20 Index Allocation: Dimensional Index Allocation data compiled by Dimensional. 80% of the weight is allocated to the Dimensional Core Market 100/0 Index Allocation and 20% of the weight is allocated to the following fixed income indices: Dimensional Short-Term Extended Quality Index (10%) and Dimensional US Core Fixed Income Index (10%). The Index Allocation returns are calculated monthly as a weighted average of the returns of the underlying indices. The Dimensional Short-Term Extended Quality Index is represented by Bloomberg US Government/Credit 1–5 Year Bond Index from January 1985 to December 1995. The Dimensional US Core Fixed Income Index is represented by Bloomberg US Aggregate Bond Index from January 1985 to January 1989 and the US Government/ Credit Simulation plus Bloomberg US Mortgage-Backed Securities Index (70% non-MBS/30% MBS) from February 1989 to August 2005. The Index Allocation has been retrospectively calculated by Dimensional and did not exist prior to March 2020.
Dimensional Core Market 60/40 Index Allocation: Dimensional Index Allocation data compiled by Dimensional. 60% of the weight is allocated to the Dimensional Core Market 100/0 Index Allocation and 40% of the weight is allocated to the following indices: Dimensional Short-Term Extended Quality Index (25%) and Dimensional US Core Fixed Income Index (15%). The Index Allocation returns are calculated monthly as a weighted average of the returns of the underlying indices. The Dimensional Short-Term Extended Quality Index is represented by Bloomberg US Government/Credit 1–5 Year Bond Index from January 1985 to December 1995. The Dimensional US Core Fixed Income Index is represented by Bloomberg US Aggregate Bond Index from January 1985 to January 1989 and the US Government/Credit Simulation plus Bloomberg US Mortgage-Backed Securities Index (70% non-MBS/30% MBS) from February 1989 to August 2005. The Index Allocation has been retrospectively calculated by Dimensional and did not exist prior to March 2020.
Dimensional Core Market 40/60 Index Allocation: Dimensional Index Allocation data compiled by Dimensional. 40% of the weight is allocated to the Dimensional Core Market 100/0 Index Allocation and 60% of the weight is allocated to the following indices: Dimensional Short-Term Extended Quality Index (40%) and Dimensional US Core Fixed Income Index (20%). The Index Allocation returns are calculated monthly as a weighted average of the returns of the underlying indices. The Dimensional Short-Term Extended Quality Index is represented by Bloomberg US Government/Credit 1–5 Year Bond Index from January 1985 to December 1995. The Dimensional US Core Fixed Income Index is represented by Bloomberg US Aggregate Bond Index from January 1985 to January 1989 and the US Government/Credit Simulation plus Bloomberg US Mortgage-Backed Securities Index (70% non-MBS/30% MBS) from February 1989 to August 2005. The Index Allocation has been retrospectively calculated by Dimensional and did not exist prior to March 2020.
Dimensional Core Market 20/80 Index Allocation: Dimensional Index Allocation data compiled by Dimensional. 20% of the weight is allocated to the Dimensional Core Market 100/0 Index Allocation and 80% of the weight is allocated to the following indices: Bloomberg US TIPS Index (10%), Dimensional US Ultra-Short Fixed Income Index (10%), Dimensional Short-Term Extended Quality Index (50%), and Dimensional US Core Fixed Income Index (10%). The Index Allocation returns are calculated monthly as a weighted average of the returns of the underlying indices. The Dimensional Short-Term Extended Quality Index is represented by Bloomberg US Government/Credit 1–5 Year Bond Index from January 1985 to December 1995. The Dimensional US Core Fixed Income Index is represented by Bloomberg US Aggregate Bond Index from January 1985 to January 1989 and the US Government/Credit Simulation plus Bloomberg US Mortgage-Backed Securities Index (70% non-MBS/30% MBS) from February 1989 to August 2005. The Bloomberg US TIPS Index is represented by the Bloomberg US Treasury Bond Index from January 1985 to February 1997. The Dimensional US Ultra-Short Fixed Income Index is represented by the ICE BofA US 3-Month Treasury Bill Index from January 1985 to January 1999. The Index Allocation has been retrospectively calculated by Dimensional and did not exist prior to March 2020. Dimensional Core Market 0/100 Index Allocation: Dimensional Index Allocation data compiled by Dimensional. The Dimensional Core Market 0/100 Index Allocation combines the following indices: Bloomberg US TIPS Index (20%), Dimensional US Ultra Short Fixed Income Index (20%), and Dimensional Short-Term Extended Quality Index (60%). The Index Allocation returns are calculated monthly as a weighted average of the returns of the underlying indices. The Dimensional Short-Term Extended Quality Index is represented by Bloomberg US Government/Credit 1–5 Year Bond Index from January 1985 to December 1995. The Bloomberg US TIPS Index is represented by the Bloomberg US Treasury Bond Index from January 1985 to February 1997. The Dimensional US Ultra-Short Fixed Income Index is represented by the ICE BofA US 3-Month Treasury Bill Index from January 1985 to January 1999. The Index Allocation has been retrospectively calculated by Dimensional and did not exist prior to March 2020.
The information in this material is intended for the recipient’s background information and use only. It is provided in good faith and without any warranty or representation as to accuracy or completeness. Information and opinions presented in this material have been obtained or derived from sources believed by Dimensional to be reliable, and Dimensional has reasonable grounds to believe that all factual information herein is true as at the date of this material. It does not constitute investment advice, a recommendation, or an offer of any services or products for sale and is not intended to provide a sufficient basis on which to make an investment decision. Before acting on any information in this document, you should consider whether it is appropriate for your particular circumstances and, if appropriate, seek professional advice. It is the responsibility of any persons wishing to make a purchase to inform themselves of and observe all applicable laws and regulations. Unauthorized reproduction or transmission of this material is strictly prohibited. Dimensional accepts no responsibility for loss arising from the use of the information contained herein.
This material is not directed at any person in any jurisdiction where the availability of this material is prohibited or would subject Dimensional or its products or services to any registration, licensing, or other such legal requirements within the jurisdiction. “Dimensional” refers to the Dimensional separate but affiliated entities generally, rather than to one particular entity. These entities are Dimensional Fund Advisors LP, Dimensional Fund Advisors Ltd., Dimensional Ireland Limited, DFA Australia Limited, Dimensional Fund Advisors Canada ULC, Dimensional Fund Advisors Pte. Ltd., Dimensional Japan Ltd., and Dimensional Hong Kong Limited. Dimensional Hong Kong Limited is licensed by the Securities and Futures Commission to conduct Type 1 (dealing in securities) regulated activities only and does not provide asset management services.
RISKS
Investments involve risks. The investment return and principal value of an investment may fluctuate so that an investor’s shares, when redeemed, may be worth more or less than their original value. Past performance is not a guarantee of future results. There is no guarantee strategies will be successful.
UNITED STATES
Dimensional Fund Advisors LP is an investment advisor registered with the Securities and Exchange Commission. Investment products: • Not FDIC Insured • Not Bank Guaranteed • May Lose Value Dimensional Fund Advisors does not have any bank affiliates.
AUSTRALIA
This material is issued by DFA Australia Limited (AFS License No. 238093, ABN 46 065 937 671). This material is provided for information only. No account has been taken of the objectives, financial situation or needs of any particular person. Accordingly, to the extent this material constitutes general financial product advice, investors should, before acting on the advice, consider the appropriateness of the advice, having regard to the investor’s objectives, financial situation and needs. Investors should also consider the Product Disclosure Statement (PDS) and the target market determination (TMD) that have been made for each financial product either issued or distributed by DFA Australia Limited prior to acquiring or continuing to hold any investment. Go to dimensional.com/funds to access a copy of the PDS or the relevant TMD. Any opinions expressed in this material reflect our judgement at the date of publication and are subject to change.
NEW ZEALAND
This material is issued by DFA Australia Limited (incorporated in Australia, AFS License No. 238093, ABN 46 065 937 671). This material is provided for information only. This material does not give any recommendation or opinion to acquire any financial product or any financial advice product, and is not financial advice to you or any other person. No account has been taken of the objectives, financial situation or needs of any particular person. Accordingly, investors should, before acting on the advice, consider the appropriateness of the advice, having regard to the investor’s objectives, financial situation and needs. Investors should also consider the Product Disclosure Statement (PDS) and for the Dimensional Wholesale Trusts the target market determination (TMD) that have been made for each financial product or financial advice product either issued or distributed by DFA Australia Limited prior to acquiring or continuing to hold any investment. Go to dimensional.com/funds to access a copy of the PDS or the relevant TMD. Any opinions expressed in this material reflect our judgement at the date of publication and are subject to change.
WHERE ISSUED BY DIMENSIONAL IRELAND LIMITED
Issued by Dimensional Ireland Limited (Dimensional Ireland), with registered office 3 Dublin Landings, North Wall Quay, Dublin 1, Ireland. Dimensional Ireland is regulated by the Central Bank of Ireland (Registration No. C185067).
WHERE ISSUED BY DIMENSIONAL FUND ADVISORS LTD.
Issued by Dimensional Fund Advisors Ltd. (Dimensional UK), 20 Triton Street, Regent’s Place, London, NW1 3BF. Dimensional UK is authorized and regulated by the Financial Conduct Authority (FCA) - Firm Reference No. 150100. Dimensional UK and Dimensional Ireland do not give financial advice. You are responsible for deciding whether an investment is suitable for
your personal circumstances, and we recommend that a financial adviser helps you with that decision. Dimensional UK and Dimensional Ireland issue information and materials in English and may also issue information and materials in certain other languages. The recipient’s continued acceptance of information and materials from Dimensional UK and Dimensional Ireland will constitute the recipient’s consent to be provided with such information and materials, where relevant, in more than one language.
NOTICE TO INVESTORS IN SWITZERLAND: This is advertising material.